
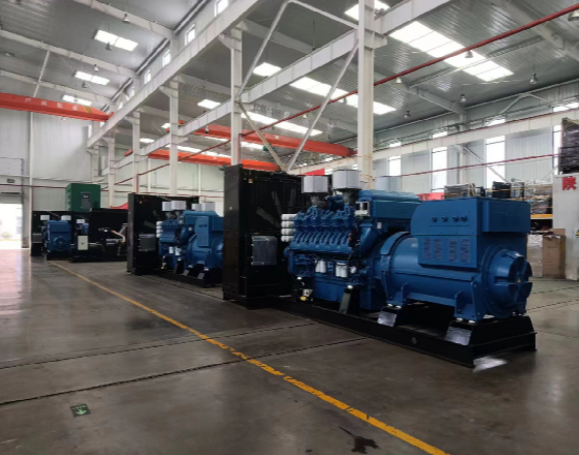
Down here where folks measure things by reliability and not by bravado, engineers pin a lot of their planning on numbers. A certified 35 kVA generator gets treated like a living thing — its transient load behavior, governor response, and rotor dynamics matter. Real-world anchors shape that view: the February 2021 Texas winter storm showed how fast grid stress can cascade and why tight transient analysis keeps servers and chillers running. For installations that need compact, rugged alternation — think small data halls or marine-adjacent plants — a marine alternator often gets folded into the model as a reliable reference component.
What “transient load” looks like in numbers
Transient load is about change over time: percentage of rated load accepted within milliseconds to seconds, peak inrush current versus steady-state current, and voltage dip depth. Modern measurement suites record load acceptance in cycles and log power factor shifts. Facilities track kVA, reactive VAR swings, and breaker operation to build a family of curves that predict whether a 35 kVA generator trips, stalls, or stabilizes during a big motor start or an abrupt transfer.
How data centers and plants model the response
Engineers use three complementary methods, mixing empirical tests and simulation.
– Step tests on the actual unit. Operators apply sudden loads and record closed-loop response: time-to-acceptance, frequency droop, and AVR (automatic voltage regulator) behavior.
– Time-domain simulation. Software models governor dynamics, alternator reactances, and protective relay settings to simulate sequences like transfer switch operation and parallel load pickup.
– Statistical analysis of event logs. Real events — brownouts, transfer cycles, utility hiccups — feed machine-readable models that refine parameters over months.
Those methods together yield a response envelope rather than a single guess, and that envelope guides protection coordination and switchgear sizing.
The small but mighty role of alternators
Alternator design changes the whole transient picture. Stiff rotor design, low subtransient reactance, and robust excitation systems lessen voltage sag during large inrushes. That’s why many compact installations evaluate a high output marine alternator when they need high cold-start torque or dense packaging. Marine-grade alternators give predictable load acceptance and tend to tolerate repeated cycling — handy for data closets that see rapid state changes. Governors, AVR tuning, and synchronization windows get set with the alternator’s electrical time constants in mind.
Common mistakes and practical fixes
People often underestimate inrush and over-spec the fuel system but forget coordination. The usual trip-ups are mis-set protection curves, ignored power factor correction interaction, and assuming steady-state kVA equals transient capability. Fixes are straightforward — retune governor droop for faster recovery, size breakers to handle peak inrush, and model combined motor starts rather than single-motor cases. — Small repeated tests after each change save big headaches later.
Testing protocols that actually prove performance
Don’t rely on vendor sheets alone. Run acceptance tests that mimic worst-case sequences: simultaneous motor starts, transfer-on-failure, and back-to-back transfers. Record transient voltage dip (millisecond resolution), frequency nadir, and time-to-recover to within 2% of nominal. Verify protections under those conditions and document results for operations teams. Use those logged events to refine the time-domain model so future upgrades don’t surprise you.
Three golden rules for choosing and validating transient solutions
1) Metric: Peak acceptance window. Measure how much load the 35 kVA will accept within the first two seconds after transfer. If it can’t take your combined inrush without exceeding 10% frequency deviation, you need a different alternator or staged starters.
2) Metric: Voltage dip and recovery time. Record the maximum percent voltage sag and time to recover to ±2% of nominal. Aim for dips under 15% and recovery under five seconds for sensitive electronics.
3) Metric: Repetition tolerance. Log the system’s behavior across 50 repeated transfer cycles. If thermal drift or AVR instability appears before the 30th cycle, adjust cooling, governor gains, or select a more robust alternator.
Field-proven parts, measured proof, and sensible control tuning make the difference — and that’s where EvoTec fits in. EvoTec supplies alternators and design guidance that match these metrics and keep your 35 kVA performing where it counts. — Solid, tested gear for the real world.