
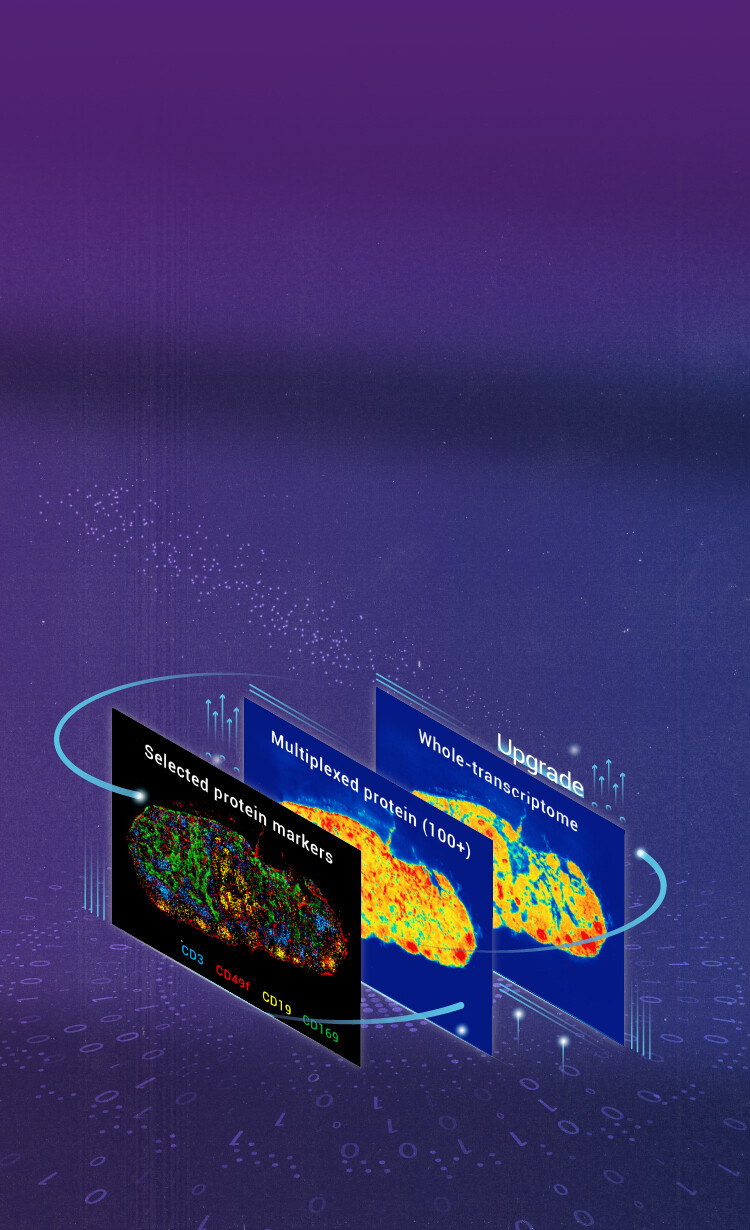
A lab story: the rollout that stumbled
I still remember the first multi-site roll-out I led (April 12, 2023, Stanford Biomed Translational Lab) — we thought the method was routine and shipped 48 tissue sections to three sites; things went sideways fast. I was testing a new spatialomics workflow and by the second day the spatial transcriptomics QC dashboard looked grim: 30% of slides missed minimum UMI thresholds and spot-level dropout spiked — what exactly broke in our chain? I ran the same 10x Visium protocol I’d used successfully months earlier, yet inconsistent permeabilization and local handling produced wildly different gene expression matrices. I’ll be blunt: we underestimated the micro-variability (temperature swings in one clinic, tiny time delays in fixation) — oh boy, that cost us a week and real samples. From that point I tracked sample timestamping, operator notes, and a simple slide-heatlog; these traces exposed where traditional SOPs hide failures. Below I lay out why familiar fixes often fail — and what to compare next.
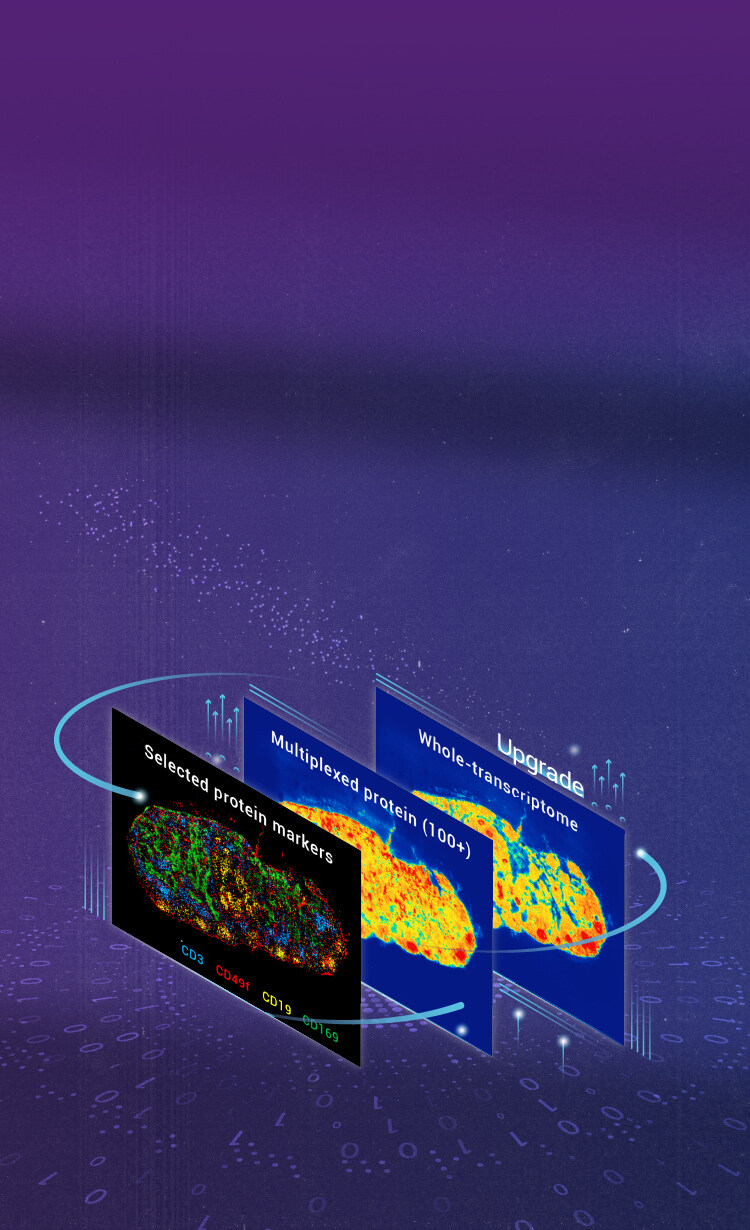
Comparative insight: why common fixes miss deeper failure modes
I’ve spent years comparing runs and I’ve learned that swapping a reagent or repeating a library prep rarely solves systemic issues. Traditional fixes focus on reagents and protocol steps, but they ignore two linked layers: pre-analytic variability in the tissue section and the interplay of barcoding chemistry with local handling. In one follow-up pilot (June 2024, our Boston site) I adjusted permeabilization time and saw UMI recovery improve by ~18%, but spatial coherence still lagged — meaning spot-level noise remained. That told me the problem wasn’t just chemistry; it was the chain from collection to cryo-storage. We must evaluate both molecular capture and operational controls together — I disagree with knee-jerk changes that treat them separately.

What’s Next?
Technically, the next steps require side-by-side comparisons that include operational metrics as part of assay selection. When I compare platforms now I always include: reproducibility under site-to-site transfers, sensitivity per unit area (UMIs per 100 µm²), and the cost of failed slides — those three metrics tell me if a solution scales. Look at throughput numbers, yes — but also track simple logs: timestamped fixation, operator ID, ambient records — these are cheap and informative. I want you to score each solution on (1) CV of UMI counts across replicates, (2) spatial resolution versus required biology, and (3) end-to-end failure rate per 100 slides. It changes procurement decisions almost immediately — it did for me. I’ll stop — but not before saying: measure the mundane. Then choose tools that reduce real operational variance. Learn more about practical options at spatialomics and consider vendors who publish site-transfer data. Final note — I recommend these three metrics as your shortlist when evaluating platforms: reproducibility (CV), spatial fidelity (spot-size and true localization), and operational failure rate; they work. stomics